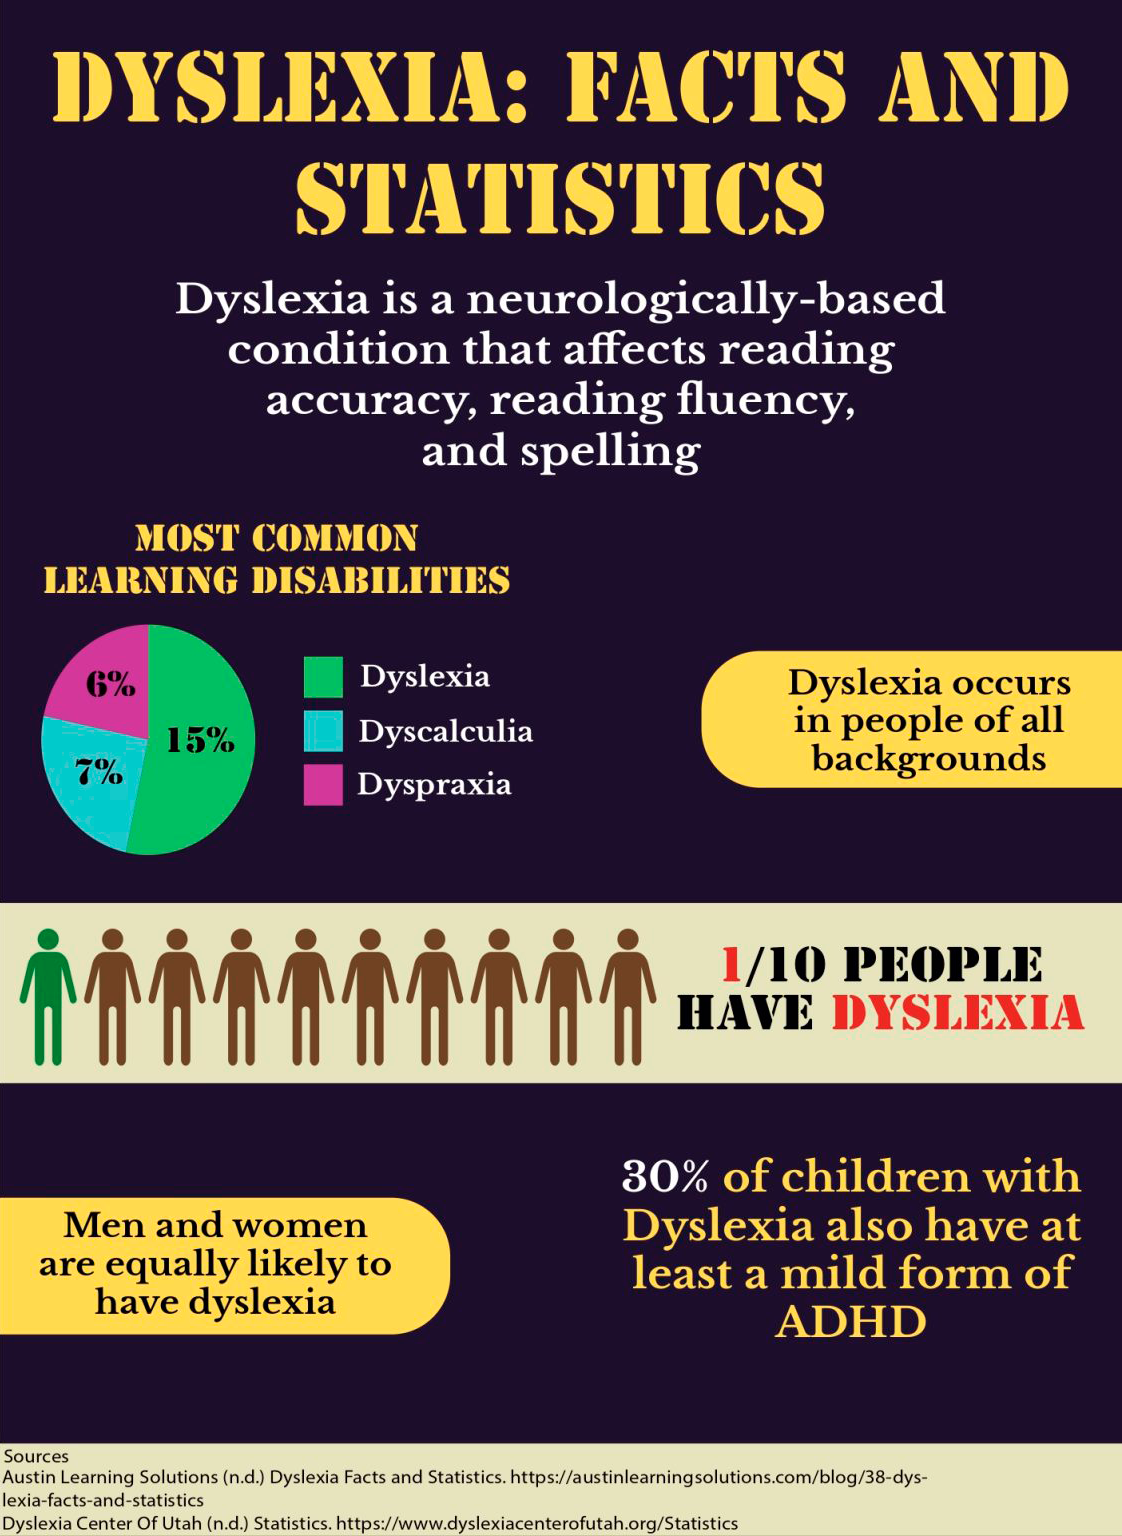
Statistics and data can be challenging to understand when presented in raw numerical form.
This infographics was made to transform these statistics into visual representations like charts, graphs, and icons. This makes it easier for readers to grasp the significance of the data and its implications for individuals with dyslexia.